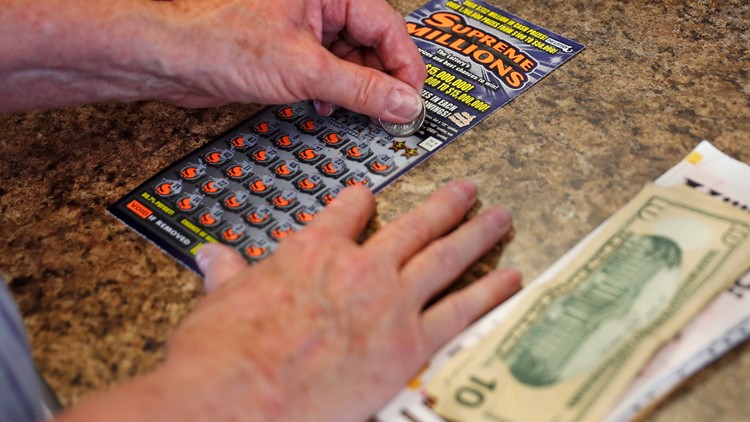
WARREN, Mich. — While the growing expansion of casinos and state-sanctioned sports betting steal the spotlight, state lotteries have nearly doubled in size over the past two decades, driving a multibillion-dollar wealth transfer from low-income U.S. communities to powerful multinational companies.
A nationwide investigation of state lotteries by the Howard Center for Investigative Journalism at the University of Maryland found that lottery retailers are disproportionately clustered in lower-income communities in nearly every state. The investigation’s analysis of cellphone location data shows that the people who patronize those stores come from the same kinds of communities.
Once rare, lotteries now operate in all but five U.S. states. Driven by more than a half-billion dollars in annual ad spending, lottery ticket sales have grown from $47 billion to $82 billion since 2005, according to La Fleur’s 2022 World Lottery Almanac. In 10 states, lotteries generate more revenue than corporate income taxes.
The investigation also found that a key promise of lotteries across the country — that they support education — doesn’t hold up. Instead, lotteries often compound inequities by disproportionately benefiting college students and wealthier school districts far from the neighborhoods where most tickets are sold.
“Poor people are collateral damage to a cause of raising money for what the legislators feel is good purposes … public safety, local schools,” said Gregory W. Sullivan, a former Massachusetts inspector general and now research director for a free-market think tank in Boston.
The multibillion-dollar wealth transfer starts in places like Warren, Michigan, where Ashley Standifer buys tickets in one of the state’s poorest neighborhoods.
On a snowy April day, Standifer stopped by the Korner Party Store in this Detroit suburb, its largest sign advertising “Beer Wine Lotto,” to buy scratch-off tickets.
She buys scratch tickets three times daily. Four years ago, she won $1,000 on a $3 ticket, but she hasn’t won big since.
“Of course, you know, I’m expecting to get my money back,’’ Standifer said. “But if I don’t … I’m still gonna buy it.”
Standifer’s spending is one small part of the $82 billion spent annually by lottery players, the first input in a nearly nationwide system that brings state-sponsored gambling directly into a majority of U.S. neighborhoods through more than 200,000 stores.
Standifer — and millions of players like her — lose about 35 cents for every dollar they spend.
“Yesterday I spent like $130 and I won like $85,” Standifer said, meaning she lost $45.
Those losses — $29 billion a year nationally — are why lotteries exist. The losses fund government programs and enrich others, including a Canadian private equity billionaire and a Japanese convenience-store conglomerate.
In the popular imagination, the lottery is funded by people who spend a few dollars on a Powerball ticket when the jackpot gets big. This is not reality.
More than two-thirds of lottery sales are of instant scratch-off tickets, which range in price from $1 to $50. A sliver of players are responsible for most of that spending.
A 1999 report to the National Gambling Impact Study Commission found the top 10% of lottery spenders accounted for two-thirds of sales. The most frequent players, the study found, had lower incomes, were high school dropouts and disproportionately Black.
High school dropouts spent four times more per year than college graduates. Black people spent, on average, nearly five times as much as white people.
Some states, like Massachusetts, are aware of frequent players’ importance. A 2016 study commissioned by the lottery showed that the top 10% of players account for about 40% of sales. The average player in that group reported lottery spending of nearly $200 per week.
In South Carolina, players with a household income of less than $35,000 a year spent more than twice as much as players with household incomes between $100,000 and $150,000, according to a 2014 state-commissioned study obtained by the Howard Center.
“When people get down, they probably take the last 10 or 20 dollars to try to make up 100 to 400 dollars,” said Cloyd White, 26, a construction worker from Jasper County, South Carolina, who estimated he spent $40 every day. “It’s a gamble and it’s risky, but I feel like it’s all about God.”
It’s also about choices states make about who can sell lottery tickets.
“There’s a reason why so many lottery outlets are concentrated in low-income areas across the United States,” said Les Bernal, national director of Stop Predatory Gambling.
The Howard Center found that stores in the vast majority of states with lotteries are disproportionately concentrated in communities with lower levels of education and income and higher poverty rates, with larger populations of Black and Hispanic people.
Only Alabama, Alaska, Hawaii, Utah and Nevada lack lotteries. The Howard Center was unable to obtain lottery retailer locations in South Dakota, but did obtain them for the other 44 states, plus Washington, D.C.
The center’s analysis found:
- In neighborhoods with lottery retailers, the percentage of the population that lives in poverty is higher than in neighborhoods without lottery retailers in all 44 states analyzed and in Washington, D.C.
- The Black population was higher in neighborhoods with lottery retailers than in neighborhoods without lottery retailers in 35 states and Washington, D.C.
- The Hispanic population was higher in neighborhoods with lottery retailers than in neighborhoods without lottery retailers in 37 states and Washington, D.C..
The store where Standifer bought her tickets is in a neighborhood that has a poverty rate almost three times Michigan’s average. It has four lottery retailers, with another 28 in bordering neighborhoods.
Neighborhoods with a lottery retailer in Michigan have a median poverty rate nearly double the rate in neighborhoods without lottery retailers, the center’s analysis found.
The North American Association of State and Provincial Lotteries, an industry group, says on its website that it’s misleading to examine where stores are concentrated because people “don’t always buy their lottery tickets in the neighborhoods where they live.”
That’s true. But the Howard Center’s first-of-its-kind analysis of mobile phone location data to study customers of lottery retailers shows they are mostly local.
The center used mobile location data from SafeGraph, a location intelligence firm that collects information about store foot traffic at U.S. businesses. The aggregated SafeGraph data reveals the neighborhoods where a store’s customers live.
A Marathon gas station in Warren, Michigan — a five-minute drive from the Korner Party Store where Standifer played — sold more than $725,000 in lottery tickets in 2020, ranking among the top 20% of retailers statewide.
More than two-thirds of its customers live in the same neighborhood as the gas station or in surrounding neighborhoods, with the average customer living within 1.1 miles of the store.
The Howard Center analysis, which examined store traffic patterns at nearly three-quarters of all U.S. lottery retailers, found similar patterns nationally. In all but Arizona and Washington, D.C, a majority of lottery retailers had a customer base that mainly came from local neighborhoods.
The Marathon gas station’s visitors came from neighborhoods with a household income $16,000 less on average than Michigan’s median of $57,000. In 29 of 44 states it analyzed and in Washington, D.C., the Howard Center found a similar divide, where the average household income of neighborhoods that visited lottery retailers was lower than the state’s overall average income.
A Howard Center review found states recruit retailers based on factors like store security, the ability to hit sales targets and compliance with in-store advertising requirements. The review found no evidence that states consider racial or economic inequity.
As a group, players lose. But there are consistent winners: the multinational companies that run the lotteries on behalf of the states, the stores — including large chains — and advertising and media companies.
Of $29 billion lost by players, those entities — plus state administrators who oversee the process — will keep more than a quarter: $8 billion.
The lottery operations industry is dominated by two private companies, U.K.-based International Game Technology PLC and Canadian-owned Scientific Games Holdings LP.
State-level lobbying by Scientific Games in the 1980s was critical to the expansion of the lottery from one state, New Hampshire in 1964, to nearly every state. Scientific Games just sold its lottery business to Toronto-based private equity firm Brookfield Business Partners LP for nearly $6 billion. Future profits will benefit Brookfield CEO Bruce Flatt, who is worth $4.5 billion, according to Forbes.
Stores get a commission for selling tickets and cashing in winning tickets. They earn, on average, 6%, but also earn substantial bonuses when a customer wins big. They took in $5 billion in 2020, according to the La Fleur’s almanac.
Convenience stores account for nearly two-thirds of lottery sales. Major multinational firms profit from owning thousands of U.S. convenience stores, including the Japanese firm Seven & i Holdings, which has more than 10,000 7-Eleven and Speedway stores.
Many states permit sales at stores that specifically market to low-income clientele. Check-cashing stores, patronized by lower-income people who don’t have bank accounts, sell lottery tickets in 24 states, the Howard Center found.
After prizes are paid out and the costs of running the lottery are paid for, $21 billion of the original $82 billion remains for spending on government programs.
At least two-thirds of the $21 billion is earmarked for education programs.
The Michigan lottery, where Standifer plays, has for decades billed itself as a win for education. The vast majority of the state’s share of lottery funding is used for K-12 education funding.
Studies show the state’s education funding formula is inequitable. Michigan received a grade of “D” for how it allocates funding to low-poverty districts, according to a 2021 report from the Education Law Center.
The report classified 15 states as regressive, which meant high-poverty districts received as much as a third less per student than their low-poverty counterparts. Six of the those states — Florida, Illinois, Michigan, Missouri, New Hampshire and Texas – have lotteries that use at least a portion of funds to finance K-12 education programs.
Some states use lottery revenue to fund college scholarships.
In Kentucky, nearly half of lottery scholarship funding supports the Kentucky Educational Excellence Scholarship (KEES), which awards money based on a student’s GPA and test scores.
Nearly 10% of Kentucky high school students are Black, but they were awarded less than 5% of KEES merit-based scholarship funding, a Howard Center analysis of 2020 state scholarship data shows. The average white KEES recipient got an award of $1,745, compared with $1,244 for the average Black KEES recipient.
The same disparity did not appear in the state’s need-based scholarships, where Black students received about 11% of funds.
University of Louisville senior Abby Donahue, 21, said gambling is a “system designed to make you lose.”
But, she added, college is so expensive, and students are so desperate for scholarships, that they do not think about where the money comes from.
Meanwhile, Standifer and millions of others like her continue to play.
___
Howard Center reporters Brandie Bland, Jillian Diamond, Vanessa G. Sanchez and Lauren Mowry contributed to this story. Melissa Ellin, Isabel Tehan and Ethan Biddle of Boston University also contributed.
This story by the Howard Center for Investigative Journalism at the University of Maryland was produced in collaboration with Boston University. The Howard Center is funded by a grant from the Scripps Howard Foundation in honor of newspaper pioneer Roy W. Howard.


