Connecticut's Winter Outlook | What's the 'story' for winter 2021-2022
Every winter tells a different story. Some are warm and wet. Others are cold and snowy. Just like any good story, sometimes there's a twist you didn't see coming.
Seasonal forecasts. I'll be the first to admit that they are not my area of expertise.
There are so many variables and no two winters are the same. But for fun, let us try to assemble the puzzle pieces and hope they point us in the right direction.
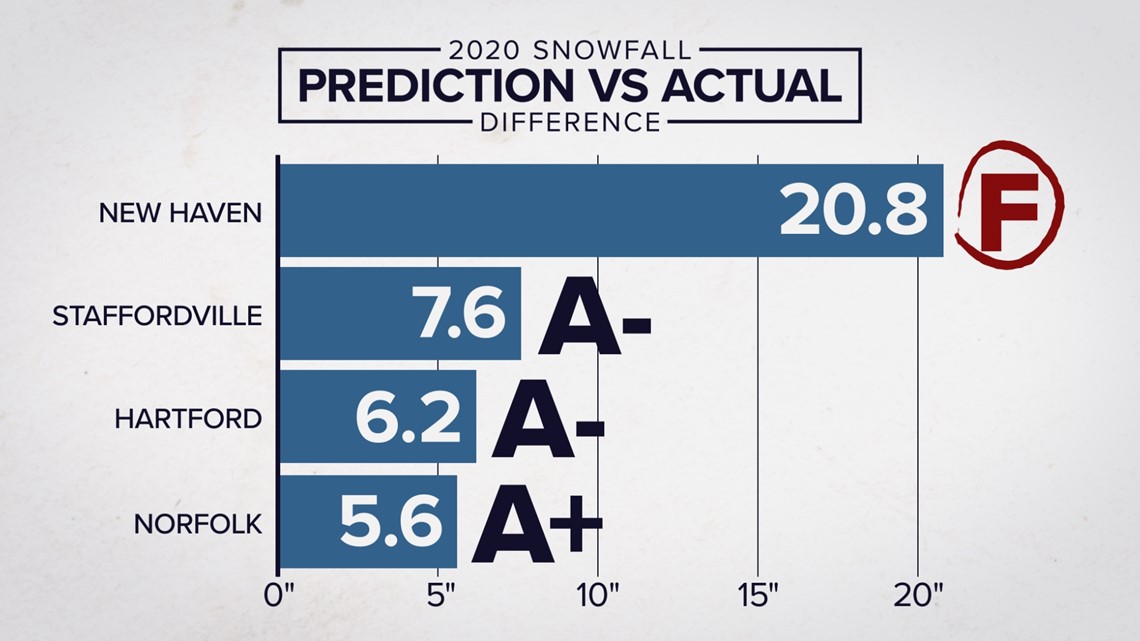
Last year, I did really well! I attribute it to one part skill, two parts luck.

Every year represents a new forecast challenge. If you just want to know what the outlook for Connecticut might be – just jump to the conclusion. (Click the tab at the top).
However, for the weather enthusiasts out there, keep reading for a more in-depth look behind the curtain in our predictions into the winter outlook for the Nutmeg State.
The science behind the forecast
Before we begin, here are the factors to take into consideration for this year’s 2021-2022 winter forecast.
- The second year in a row of La Niña
- Eurasian snow cover in October
- Climate trends
- Above-average sea surface temperatures off the East Coast
- Arctic sea ice
- Long-range computer models
- Quasi-Biennial Oscillation
- Pacific Decadal Oscillation
- Analog years (trying to look at previous winters with a similar set-up)
La Niña: Pointing towards average precipitation

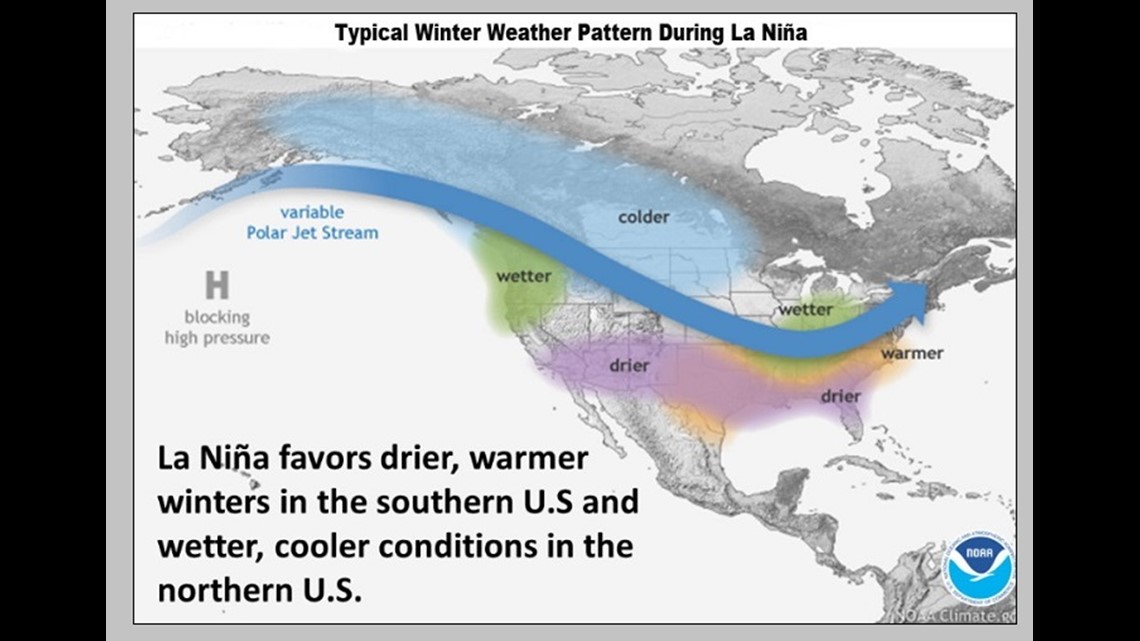
This year a major factor to consider is La Niña, unusually cooler water in the tropical pacific.
A typical La Niña year has a wave-like pacific jet stream with a strong ridge in the southeast states promoting drier and warmer than average conditions. Above-average precipitation is favored in the northwest and Great Lakes.
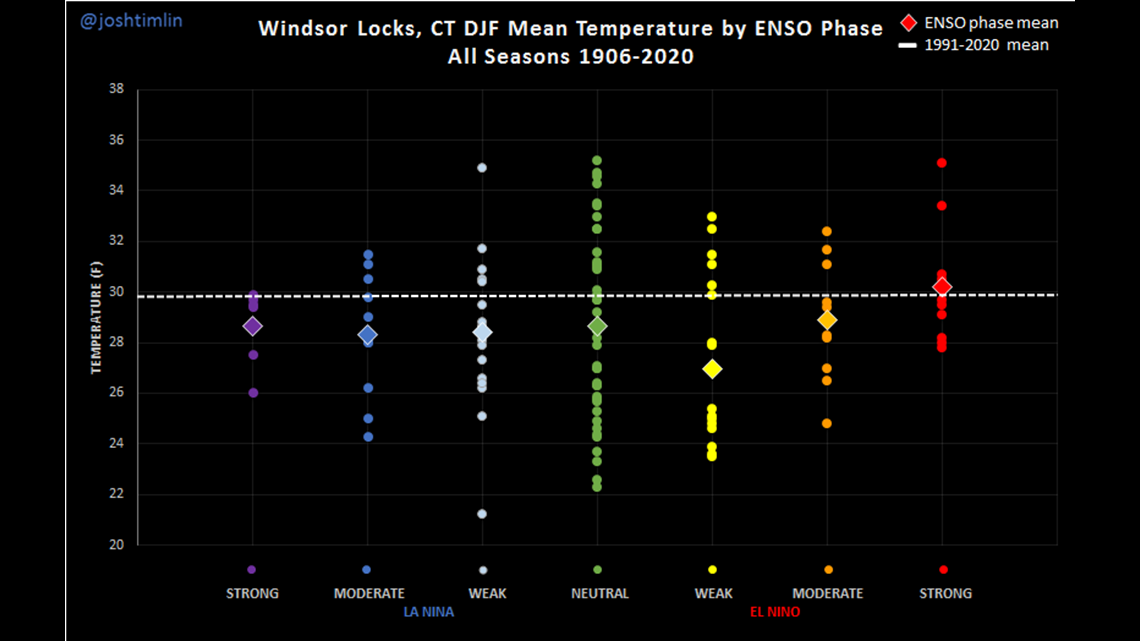
For Connecticut, temperatures usually start near average (or cooler than average) in December then trend warmer for January and February.
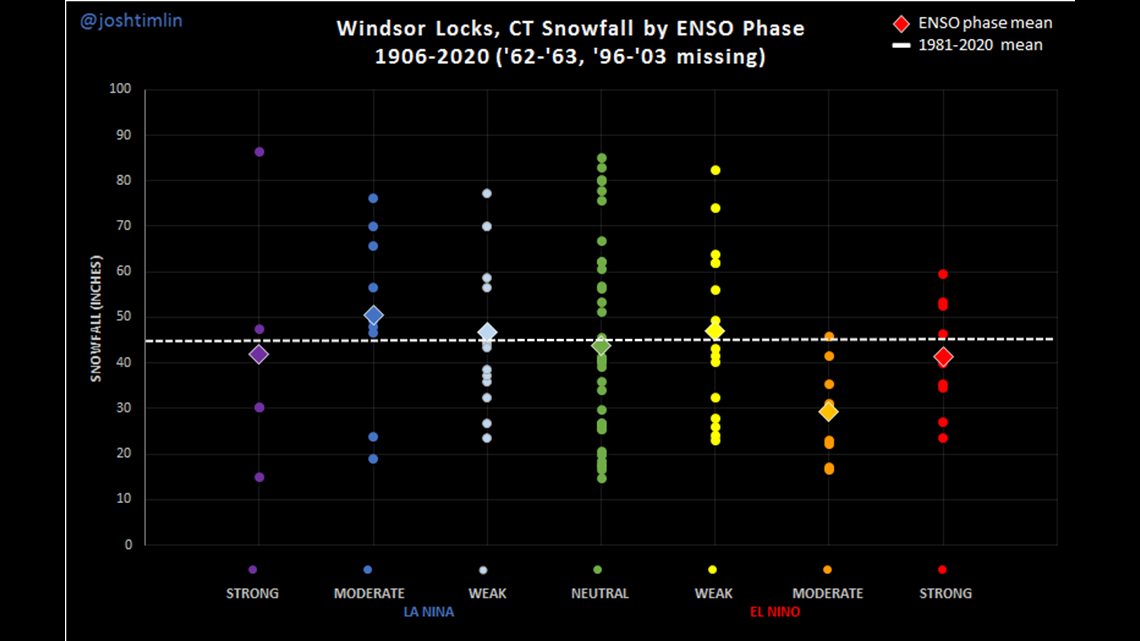
The graphic below shows the average snowfall and temperature during the winter months (December - February) in La Niña and El Niño years of varying strengths.
In La Niña years, precipitation tends to be near average but snowfall records are highly variable! This year we’re forecasting a weak to moderate La Niña. It's also the second La Niña in a row.


Climate trends & sea surface temps: Pointing towards - Warmer than average winter
Temperatures have been warming in recent years. This year the National Weather Service adjusted the 30-year average winter temperature up.

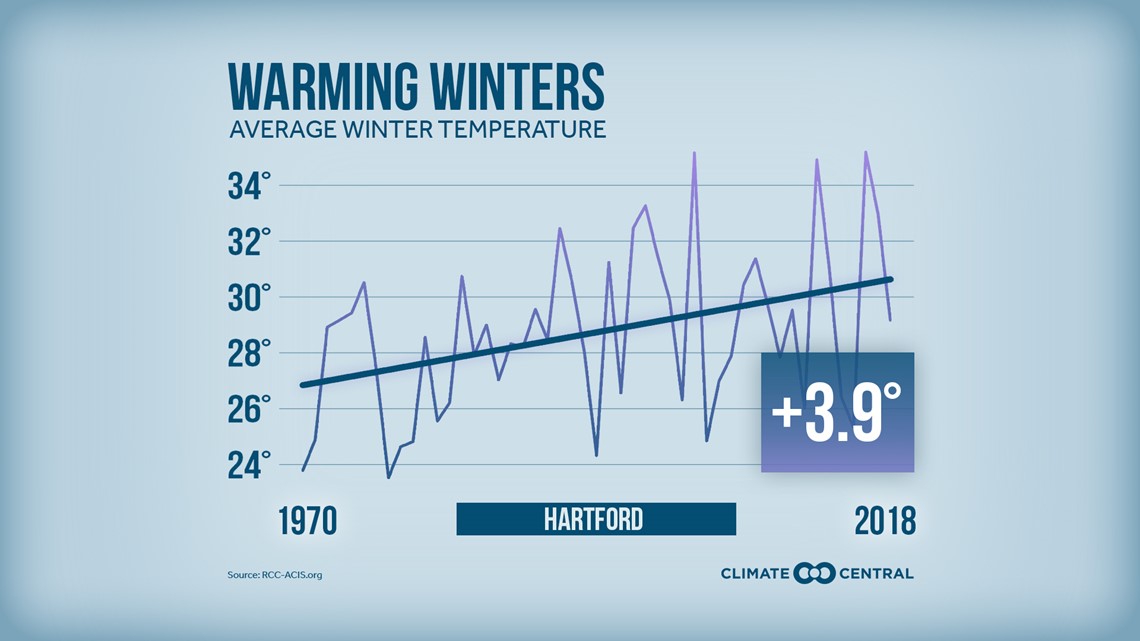
Meanwhile, cold snaps have been getting shorter in recent years.

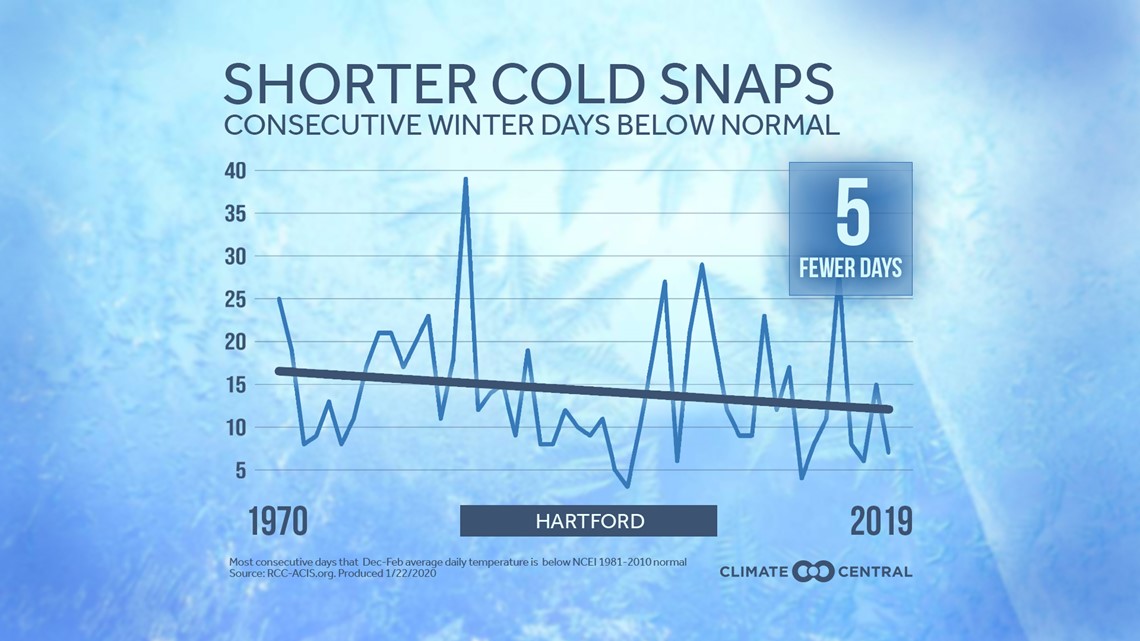
Since winters are warming, it would be easy to assume that winter snowfall would go down. But interestingly, the average snowfall has also increased.

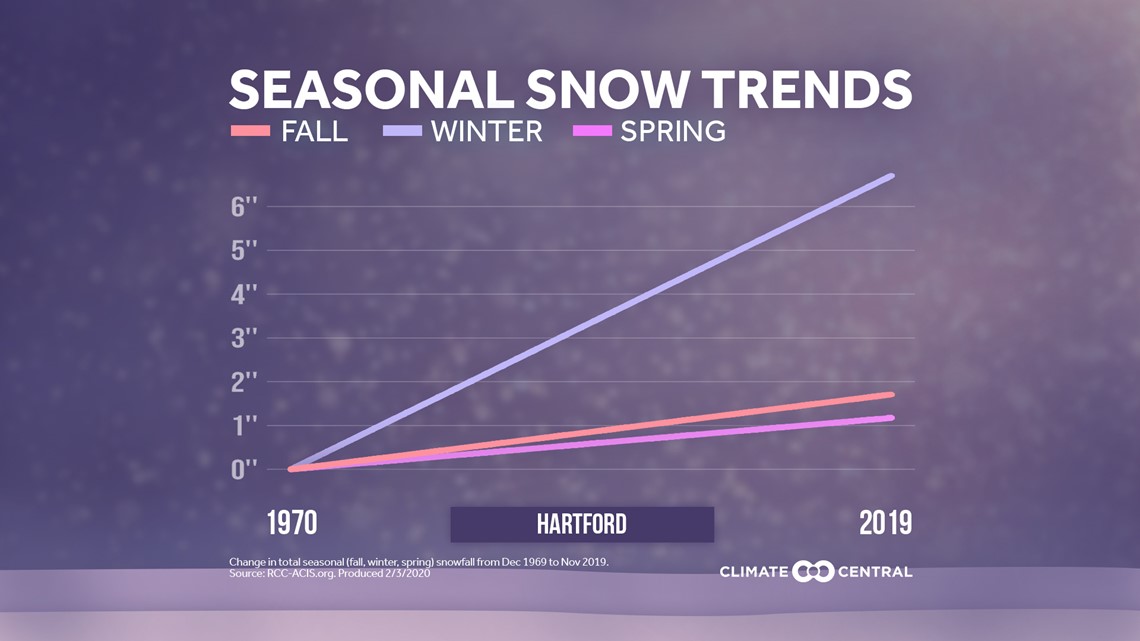
One reason may be because of the warming sea surface temperatures. The difference in the air and water temperature can help fuel more intense coastal storms.
However, warmer water can also work against snow sometimes, allowing more mixing to occur (more ice/rain instead of snow) especially for coastal areas.
Quasi-Biennial Oscillation: Pointing towards more cold blasts
This is an alternating easterly/westerly wind in the tropical stratosphere and, like La Niña, can have far-reaching impacts on global circulation. Think, the butterfly effect!
Last year the QBO was positive/westerly. This year it’s negative/easterly.
Research has shown that a negative QBO like this year can be more likely to break down the polar vortex and cause high latitude blocking to occur (with a positive AO or negative NAO developing). This can help promote more cold/blocking and potential storminess this winter.
Eurasian snow cover: Pointing towards average winter temperatures
Researchers have found a positive correlation between the amount of cold/snow in Siberia (October) to the cold/snow in the eastern US over winter. The more cold and snow in October, the weaker the polar vortex is, and the more likely that cold can break free and travel south to pay us a visit.
This October snowfall was on the lower side of recent years but also still slightly above average.
HOWEVER, this snow cover is rapidly recovering and spreading in November now. With conflicting signals and a lack of expertise in this field, I didn’t weigh this factor too heavily.
Pacific Decadal Oscillation: Pointing towards warmer than average
The PDO is a sea surface climate cycle describing temperature anomalies over the northeast Pacific Ocean.
When the water is in a cooler phase like this year (negative PDO), air temperatures on the east coast tend to be warmer in the winter.
This can be enhanced in a La Niña year, promoting a ridge to develop in the southeast pumping in milder air for the eastern United States.
Analog years: Pointing towards near to slightly below average snowfall
This one is always tough because no two years are exactly alike! I started looking at years with record summer rain, an active tropical season and moderate La Niña.
Three years were a match: 1955, 2008 and 2011.
But that sampling is too small and variable to draw any connection. For example, this includes the cold and snowy winter of 1955-56 (76”) and the warm and nearly snowless winter of 2011-12 (26.7”).
I also looked at winters with back-to-back La Niña conditions. Interestingly, (cover your eyes, snow-lovers) the nearly snowless winter of 2011-2012 was another match (though certainly an outlier).
Back to back La Niña winters:
- 2008-2009: 45.5” | Colder than average
- 2011-2012: 26.7” | Warmer than average
- 74-75: 38.3” | Warmer than average
- 83-84: 43.3” | Cooler than average
- 2000-2001: 53” | Cooler than average
- 2017:2018- 56” | Average temperatures
While all these years are still highly variable, none of them were blockbuster winters. Virtually all were around or below average for snowfall.
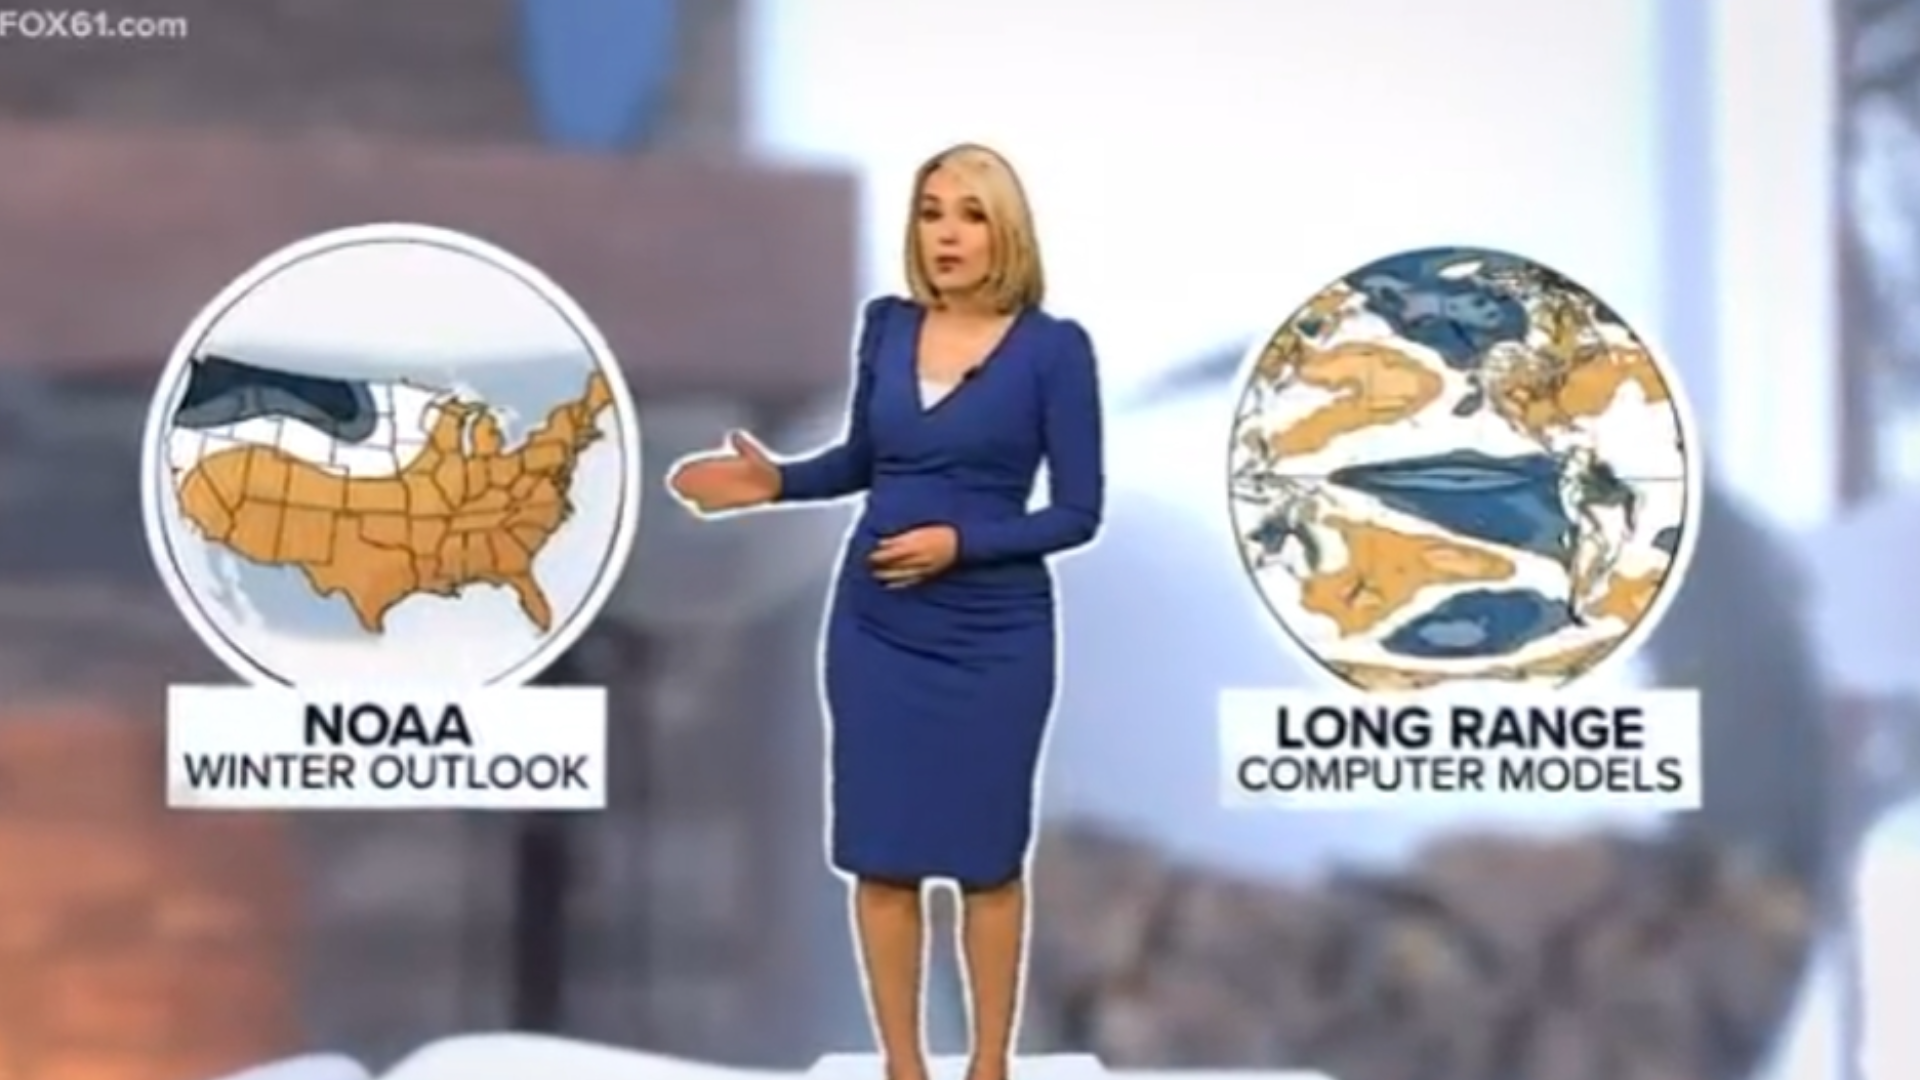
Long-range computer models and NOAA’s seasonal outlook: Pointing towards warmer than average temperatures, near average precipitation

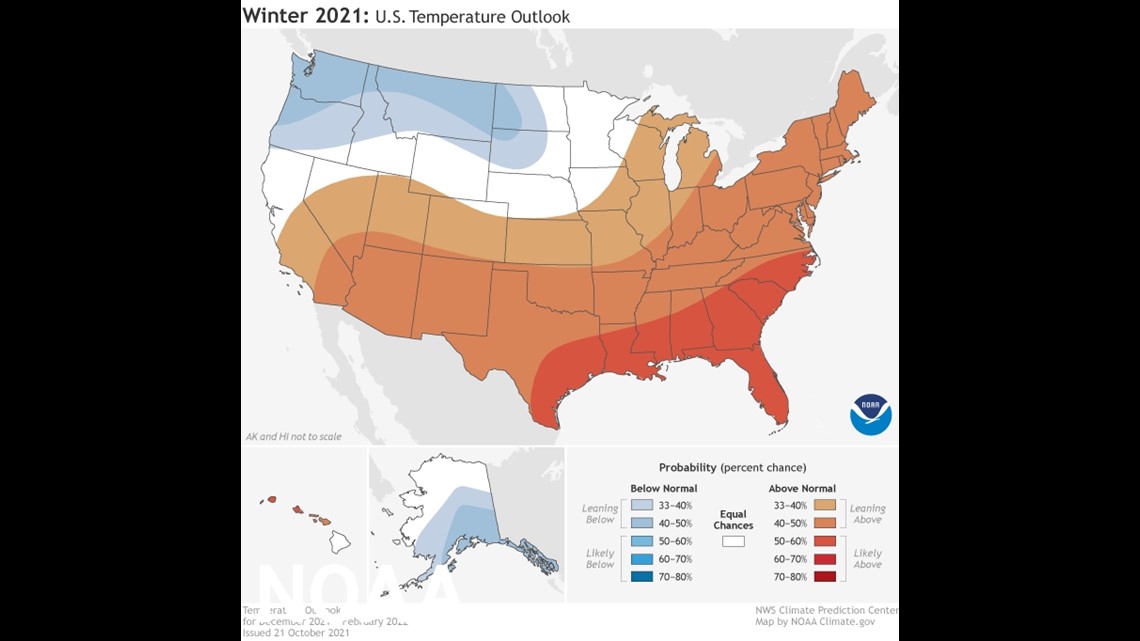
*Most* of our long-range guidance is showing above-average temperatures being favored for this winter with near-average precipitation.
NOAA’s seasonal outlook mirrors that and gets weighed heavily into my decision (many smart brains went into the creation of that forecast.)
I do want to say that the orange you see on NOAA's map above, doesn't show how warm temperatures will be but the level of confidence for above-average temperatures. So for New England, that means a 40-50% chance of above-average temperatures. NOAA is leaning towards the warmer winter idea.
But there is more confidence in above-average temperatures to our south.

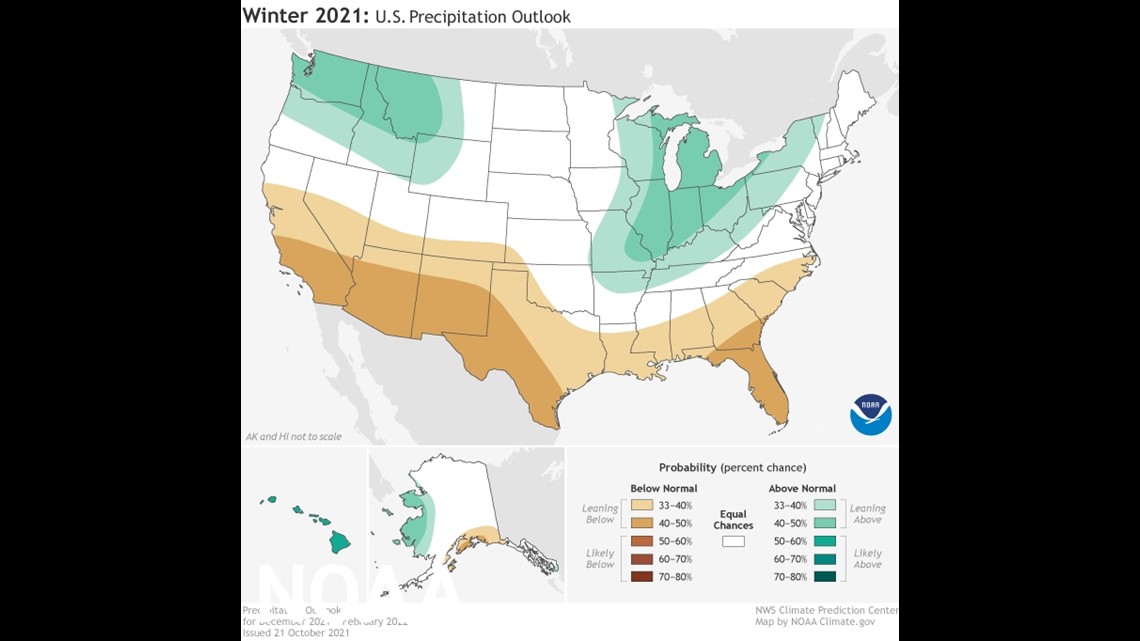
NOAA is not seeing a strong signal that would point towards above or below-average precipitation for Connecticut
Conclusion
So we put all of the conflicting signals above into a blender. There’s no proper scientific way to do this.
And you get...
1) Near-average temperatures
Range: 0.5° below average to 1.5° above average

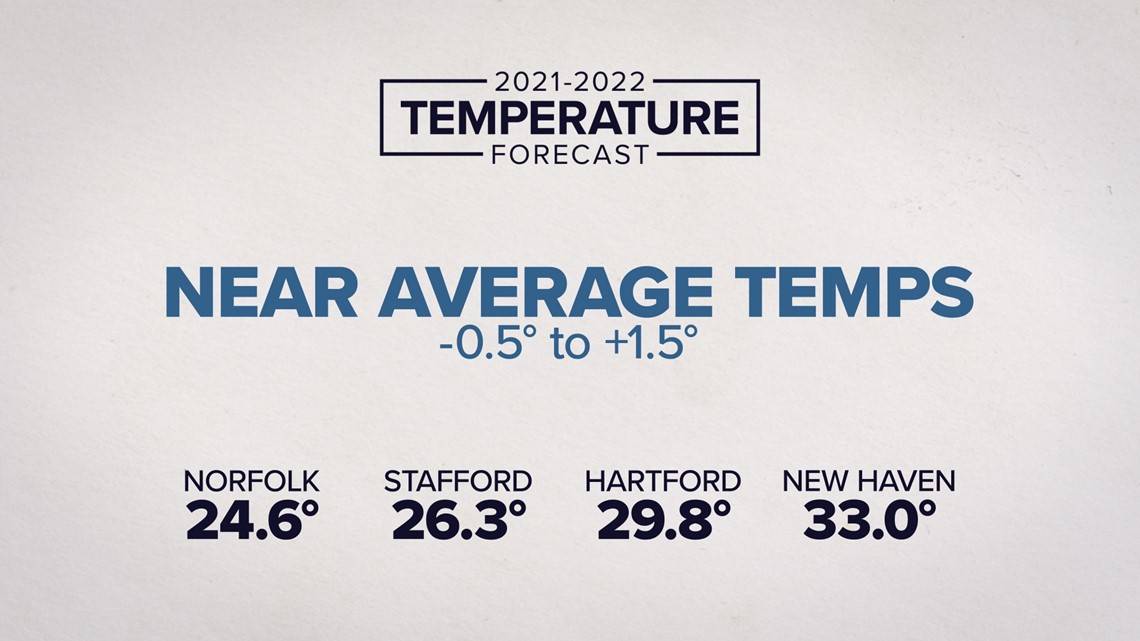
These days, a warmer than average winter is a pretty safe bet. However, with some of the signals outlined above, I think there will be times the polar vortex weakens or get blocked, sending the cold south.
Of course, the cold "coming south" doesn't always mean Connecticut. Last year it was places like Texas and Europe that got blasted. But Connecticut is at least fair game for some decent cold shots though they will lack longevity.
I think December starts off near average. This will be followed by variable temperatures in January and February, oscillating between brief shots of bitter cold and storminess followed by more prolonged thaws.
2) Near-average precipitation
3) Near/slightly below average snowfall
Range: 10" below average to 5" above average

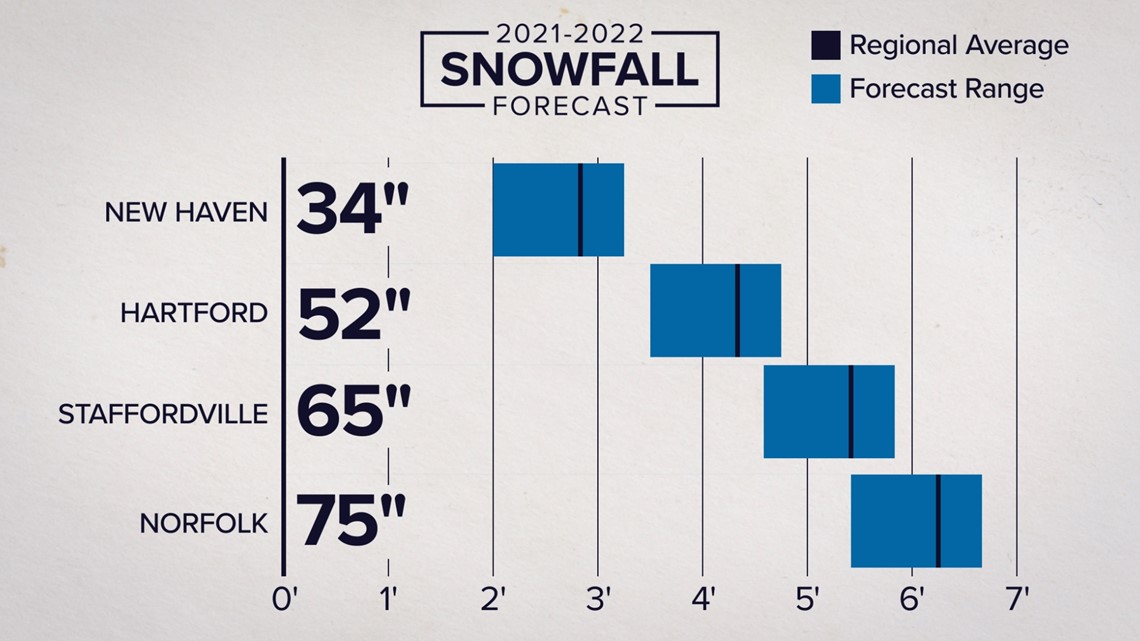
Part of a seasonal snow forecast comes down to luck! The forecast can be perfect until one big storm hits and throws off the numbers.
Or if a couple of the "big ones" miss just 50 miles farther offshore then suddenly winter is a "dud". Seasonal snow is always going to be the most challenging to forecast yet it's what people care about the most!
Of course, we’ll only know how this story ends in April!
The FOX61 weather watch team will be with you every step of the way.
Rachel Frank is the chief meteorologist at FOX61 News. She can be reached at rfrank@fox61.com. Follow her on Facebook, Twitter and Instagram.
---
Have a story idea or something on your mind you want to share? We want to hear from you! Email us at newstips@fox61.com
---
HERE ARE MORE WAYS TO GET FOX61 NEWS
Download the FOX61 News APP
iTunes: Click here to download
Google Play: Click here to download
Stream Live on ROKU: Add the channel from the ROKU store or by searching FOX61.
Steam Live on FIRE TV: Search ‘FOX61’ and click ‘Get’ to download.


